
NEWS
Delaware’s 11th-Place Gadget Score Outruns Its Monthly Tab
Delaware ranks 11th in gadget obsession, yet residents spend $83.82 a month, less than half of Utah, while Googling new devices at a high rate.

Delaware ranks 11th in a new national gadget ranking, with average electronics spending of $83.82 a month. OurPCB, a printed circuit board maker, scored the First State at 74.03 after mixing that bill with Google searches and electronics imports. Utah still sits far ahead, at $196.41 a month and a score of 99.31.
Delaware’s 11th-Place Score Hides a Modest Tab
The ranking is not a receipt from a Wilmington checkout line. OurPCB built a “Gadget Obsession Score” from three unlike piles of data: monthly consumer electronics spending, Google searches for new gadgets, and the yearly value of electronics imports per resident. Delaware’s composite landed at 74.03, good for 11th. The monthly number underneath that badge is $83.82.
That bill annualizes to $1,005.84 a person. It is a real outlay, and it is not the kind of figure that explains a top-ten finish on its own. The search leg is doing more of the work. Delaware logged 3,873 new-gadget searches on Google per 100,000 people, which OurPCB called one of the highest rates in the country, and it imported $701.92 of electronics per resident in a year.
Utah, Nevada, and New Hampshire take the podium. Oregon through Washington fill the rest of the top 10. Delaware is the first state on the list whose monthly spend was published beside the score, and that spend is the modest one.
THE TOP 11 GADGET SCORES
| Rank | State | Gadget Obsession Score |
|---|---|---|
| 1 | Utah | 99.31 |
| 2 | Nevada | 91.06 |
| 3 | New Hampshire | 89.88 |
| 4 | Oregon | 88.89 |
| 5 | North Dakota | 87.41 |
| 6 | Illinois | 86.70 |
| 7 | North Carolina | 86.25 |
| 8 | Minnesota | 80.90 |
| 9 | Colorado | 78.42 |
| 10 | Washington | 77.25 |
| 11 | Delaware | 74.03 |
Only two monthly spending figures were released with those ranks: Utah at $196.41 and Delaware at $83.82. The gap between those two checks is the part of the ranking that a score of 74.03 does not show on its face.
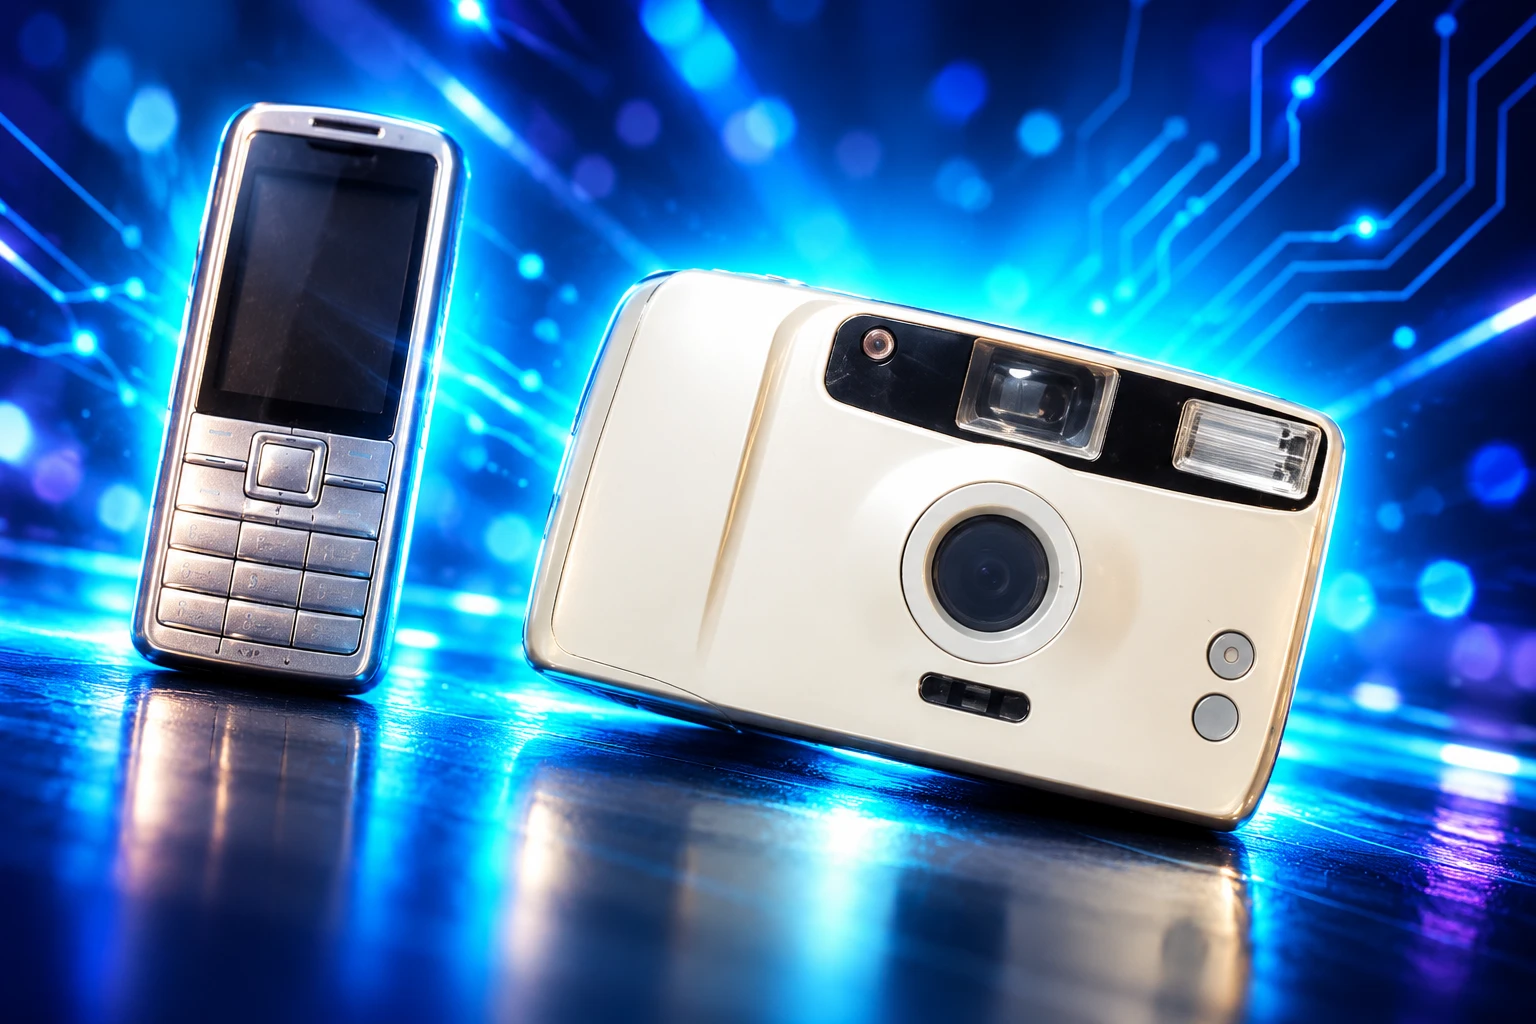
Three Metrics, One Composite Rank
Obsession, as OurPCB used the word, is a blend. A state can climb the list by paying more at retail, by Googling more gadgets, or by showing a fatter import ledger per person. Delaware’s published mix leans on the last two.
THE THREE INPUTS IN THE SCORE
- Monthly spending: The average Delaware consumer spends $83.82 on electronics, the firm said.
- Search volume: New-gadget queries run 3,873 per 100,000 people, among the highest rates OurPCB recorded.
- Import value: Electronics arriving from abroad come to $701.92 per resident each year.
The company did not publish the weights on those three legs, and it did not release monthly spending for the other top-10 states besides Utah. So a reader cannot see how many points Delaware’s search rate bought, or how much the $701.92 import line moved the needle versus the $83.82 tab. The composite still treats a Google query and a paid-for laptop as ingredients in the same stew.
Imports and retail spending are not the same basket. Customs value can include parts and equipment that never hit a consumer checkout, and a used phone bought in-state never shows up as an import. The $701.92 figure is useful as a trade snapshot. It is a shaky proxy for how hard a household is shopping.
Utah Spends More Than Twice as Much
Utah’s average consumer spends $196.41 a month, which is 2.3 times Delaware’s $83.82 and $2,356.92 across a year. That is the cleanest comparison in the ranking, because it is the only other monthly bill OurPCB put next to a score. Nevada at 91.06 and New Hampshire at 89.88 sit closer to Utah on the composite and still have no published monthly spend in the same release.
If the list were sorted only on the check, Delaware would not be in a conversation with Utah. The First State is in 11th because the score counts looking and landing freight, not just paying. Small states also move around on per-capita search stats; a few thousand extra queries show up louder when the denominator is 100,000 people.
North Dakota at 87.41 and New Hampshire at 89.88 fit that small-state pattern on the scoreboard. Illinois and North Carolina, both much larger, still outrank Delaware on the composite at 86.70 and 86.25. Without their spending and search inputs, those placements are just numbers on a list. Delaware is the state where the release handed over all three ingredients, and those ingredients do not move together.
A Circuit-Board Maker Built the Ranking
OurPCB is not a consumer pollster. It is an electronics manufacturing firm founded in 2007, with more than 3,000 customers, three factories, and four sales offices. Headquarters are in Shijiazhuang, Hebei, China. The work that pays the bills is fabrication, assembly, wire harnesses, housings, and testing, the guts of the same devices the ranking treats as objects of desire.
The company lists PCB shops in Shijiazhuang and Shenzhen, plus a wire-harness plant in Shijiazhuang operating as Cloom Tech. The Shijiazhuang assembly site covers 10,000 square meters, runs five Siemens surface-mount lines, and lists more than 300 technicians. Shenzhen covers 5,000 square meters with eight Yamaha lines and more than 100 staff. Certifications on the About page include ISO 13485, ISO 9001, and IATF 16949. A Philippines plant in the Cavite Economic Zone is listed for assembly and harness work, with an Australia sales office in Seaford, Victoria.
A vendor that sells boards has a plain interest in a public that keeps hunting for new gadgets. The ranking is content from that shop floor, not a government survey and not a receipt-level census of Delaware stores. Hommer Zhao is named in company materials as owner. The study still has to be read as a marketing dataset with three public inputs, not as a Bureau of Labor Statistics table.
Old Gadgets Stay in Closets for Nostalgia
The new-gadget search rate looks less strange next to how Delaware treats the last gadget. Secure Data Recovery surveyed 2,486 Americans in February 2025 on what they keep. Delaware placed second in the country for keeping old tech, with a hoarding score of 96.61 out of 100. Oklahoma led at 97.95. Delaware residents were the most likely in that survey to say they hold devices for nostalgia.
Nationally, 94 percent of respondents admitted they keep old tech. Charging cords led at 87 percent, old smartphones at 79 percent, and headphones at nearly three in four. The most common reason, at 69 percent, was the thought that the thing might be used again. Nostalgia was next, at nearly two thirds. Delaware’s published reason was the sentimental one, which is a different habit from Utah’s $196.41-a-month clip.
Homes in the state are already full of working devices, which leaves less room for the “obsession” label to mean a shopping spree.
DELAWARE DEVICE OWNERSHIP, 2024
- Households counted: The Census Bureau’s 2024 American Community Survey lists 412,304 households in Delaware.
- Any computer: 399,744 households, or 97.0 percent, have one or more computing devices.
- Phones and laptops: The same table finds that 92.6 percent of Delaware households have a smartphone, and 83.1 percent have a desktop or laptop.
- Tablets: 68.3 percent have a tablet or other portable wireless computer.
Those ownership rates describe a saturated market. A state where 381,786 households already have a smartphone is going to generate a lot of “what’s the new one” searches even when the monthly electronics bill stays at $83.82. Replacement cycles, not empty drawers, are what those queries usually mark.
What the National Gadget Market Looks Like in 2026
The Consumer Technology Association’s January 2026 forecast puts U.S. consumer tech revenue of $565 billion this year, up 3.7 percent. Hardware revenue is projected to rise 3.4 percent. Software and services are projected to rise 4.2 percent, to nearly $194 billion. Unit shipments are forecast to grow 0.7 percent. People are paying more per box, and they are not buying many more boxes.
Gary Shapiro, the association’s executive chair and CEO, tied that pattern to tariffs and a tighter consumer.
Even as tariffs and broader economic pressures intensify, Americans continue to invest in technology that improves productivity, connectivity, and quality of life.
Gary Shapiro, Executive Chair and CEO, Consumer Technology Association
He also said the impact of economic uncertainty is becoming more visible as companies move through pre-tariff inventories and face tougher cost decisions in 2026. CTA’s own commentary on the forecast described 2025 and 2026 as a long-tail refresh from the pandemic, with longer product lives and buyers waiting to upgrade. That national picture rhymes with Delaware’s mix of high search, a mid-pack monthly tab, and a second-place finish in keeping the last phone.
Software growing faster than hardware is the other tell. If the money is moving into subscriptions and services, a ranking that scores gadget searches and imported hardware is measuring yesterday’s object, the physical thing, while a larger share of the $565 billion is becoming a login.
Where Delaware’s Dead Devices Go
Delaware has no statewide law that forces gadget makers to finance take-back of old TVs, computers, and phones. The practical outlet is the Delaware Solid Waste Authority, which runs free electronics drop-off at four staffed centers for residents. Out-of-state material is not accepted. Hours run roughly 8:30 a.m. to 3:30 p.m. on weekdays, with Saturday hours at some sites.
WHERE TO TAKE DEAD GADGETS
- New Castle: Delaware Recycling Center, 1101 Lambson Lane, with electronics recycling on weekdays and Saturday.
- Newark: Newark Recycling Center, 470 Corporate Blvd., electronics recycling Monday through Saturday.
- Cheswold: Cheswold Recycling Center, 54 Fork Branch Rd., same weekday-and-Saturday pattern.
- Accepted gear: Computers and laptops, TVs and monitors, phones, gaming systems, and other electronics, all free for Delaware residents.
DNREC’s Recyclopedia tool tells residents which of those items can go to a drop-off and which never belong in the blue cart. Circuit boards pulled from broken devices can fall under scrap-metal or universal-waste rules if someone starts taking them apart, which is why the state tells households to send the whole unit to an electronics recycler rather than strip it in the garage.
The ranking will keep getting copied as a state-pride blurb. The number that sits under it is still $83.82 a month, the search box is still busy, and the extra remote is still in a drawer because it belonged to somebody.
Frequently Asked Questions
How Did OurPCB Calculate the Gadget Obsession Score?
OurPCB blended monthly consumer electronics spending, Google searches for new gadgets per 100,000 people, and annual electronics imports per resident, then scaled the mix into a score. The firm did not publish the weights on those three inputs, and it did not release the raw search or import figures for every state, so the 74.03 Delaware result cannot be reverse-engineered from the public tables.
Does Delaware Require Gadget Makers to Take Back Old Devices?
No. Delaware has no statewide electronics producer take-back statute that bills manufacturers for collecting TVs, computers, and phones. Universal-waste rules still cover batteries, mercury gear, lamps, and aerosol cans under Title 7, Part 273, and printed circuit boards headed for recycling can qualify for scrap-metal treatment, but the consumer path is the Solid Waste Authority’s voluntary drop-off program, not a maker-funded curb scheme.
How Many Computers and TVs Did Delaware Collect in Fiscal 2023?
The Delaware Solid Waste Authority’s electronics program collected 1,184 tons of electronic goods in fiscal 2023, including 63,408 computers, 15,648 televisions, and 4,860 printers, according to DNREC’s recycling report on that year. The service runs at four staffed drop-off centers six days a week and is used by residents, schools, nonprofits, and government offices.
How Much of U.S. Tech Revenue Comes From Software in 2026?
The Consumer Technology Association projects hardware at $371 billion and software and services at $194 billion in 2026, inside a $565 billion U.S. consumer-tech total. Software and services are 34 percent of that total, and they are the faster-growing half, at a forecast 4.2 percent increase versus 3.4 percent for hardware.

Anker’s $94 MagSafe Dock Undercuts Apple on Prime Day

LG Will Sell the Apple-Designed Lock and Thermostat

Claude Asks to Keep Voice Recordings It Once Deleted

Jeep Bets One Grand Wagoneer Can Replace Two

Kortext Buys the Study Tool Already Inside Campus Software
How to Remove Sewn-In Tags – Techniques for Tag Removal from Clothing

Long Realty Drops Lundeen After the Flight 618 Arrest

Land Rover Pushes the Electric Defender Into the 2030s

Boox Picco Drops Phone Magnets for a Pocket Linux Reader

OPEC+ Holds October Oil Output After Six Paper Hikes
-
LIFESTYLE3 years ago
How to Remove Sewn-In Tags – Techniques for Tag Removal from Clothing
-
 BUSINESS2 months ago
Long Realty Drops Lundeen After the Flight 618 Arrest
-
 AUTO2 months ago
Land Rover Pushes the Electric Defender Into the 2030s
-
 NEWS2 months ago
Boox Picco Drops Phone Magnets for a Pocket Linux Reader
-
 BUSINESS2 months ago
OPEC+ Holds October Oil Output After Six Paper Hikes
-

 GAMING1 month ago
Kalshi Asks 11 Judges to Undo a Sports-Swap Split
-

 LIFESTYLE3 years ago
American Eagle Style Number on Tag – Decoding Clothing Label Information
-

 NEWS1 month ago
swXtch.io Lets a Chat Deploy Live Media Stacks